

Google officially said goodbye to Universal Analytics and welcomed Google Analytics 4, or GA4, with open arms.
Formerly known as “App + Web”, GA4 emerged from beta in October 2020. At its core, GA4 is designed to provide a comprehensive understanding of the entire customer journey. It goes beyond traditional traffic tracking by offering insights into customer engagement, monetization, and retention, starting from the moment a customer is acquired.
It is a cross-platform analytics tool that breaks new ground by allowing businesses to track user behavior across both websites and apps. With GA4, you can gain a holistic view of how users interact with your digital assets, enabling you to optimize their experience and drive conversions.
It also effectively caters to the privacy concerns of modern online users. GA4 aligns with the latest privacy laws, such as GDPR and CCPA. By adopting a privacy-first approach, it ensures that user data is handled responsibly while still providing valuable insights for businesses.
Overview of GA4 and Its Importance in eCommerce
Let’s talk a bit about GA4 and its significance for eCommerce merchants, like yourself, no matter what platform you're using.
GA4 emerged in October 2020 as a response to evolving online privacy norms and consumer behaviors.
This new version of Google Analytics empowers eCommerce store owners with a plethora of benefits. It facilitates comprehensive data collection and analysis, advanced event tracking, and AI-driven insights. With GA4, you can make better data-driven decisions, refine marketing strategies, and enhance user experiences.
GA4 adopts an event-based tracking model that focuses on the actions users take on your app or website rather than just sessions or pageviews. This approach offers a detailed understanding of the customer journey.
Take, for instance, when a potential customer checks out your Shopify or WooCommerce shop. They browse through product details, watch a video, and then leave without buying anything. These actions are all tracked by GA4 as events.
Access to this data helps you tweak and improve your product descriptions, videos, and other key areas to boost sales.
Transition from Universal Analytics to GA4: What's New?
As Universal Analytics phases out, it’s time to get to know GA4 better.
You might be wondering how they differ.
So, let's discuss some notable distinctions between GA4 and its predecessor:
New Dashboard
The first and the most striking change is the introduction of an entirely redesigned dashboard. The new interface is sleeker and more intuitive, with several familiar reports either relocated or reimagined.
Positioned on the right-hand side, the navigation bar provides easy access to essential features such as home, reports, explore, advertising, configure, and library.
Additionally, under the "Insights" section at the bottom, you can find predictive insights generated by Google's AI, offering valuable recommendations based on data analysis.
Event-Based Tracking
GA4 adopts an event-based tracking model. Unlike Universal Analytics, where page views were the primary metric, GA4 captures all user interactions as events.
This shift provides businesses with a more comprehensive understanding of user engagement across websites and apps.
More Control Over Data
GA4 also addresses concerns over data privacy and control by emphasizing first-party data and offering more granular control over user data.
Compliance with regulations such as GDPR and CCPA is facilitated through consent options and streamlined data management processes.
More Comprehensive View of the Customer Lifecycle
GA4 provides businesses with a more comprehensive view of the customer lifecycle by tracking interactions across multiple devices and platforms.
This holistic understanding of the customer journey enables businesses to develop more targeted and effective marketing strategies, ultimately increasing revenue and customer satisfaction.
Machine Learning
GA4 is the first version of Google Analytics that integrates machine learning and AI capabilities.
By leveraging AI, GA4 fills data gaps left by users who opt out of cookie usage, providing reliable insights into user history without relying on cookies.
Additionally, machine learning algorithms analyze past data and predict future user behavior, empowering businesses to make data-driven decisions and optimize their digital experiences effectively.
Benefits of Using GA4 for eCommerce
Google Analytics 4 (GA4) offers many advantages for eCommerce store owners.
Here are some of them:
Seamless Integration with Google Ads and platforms like Shopify
Google Analytics 4 offers enhanced integration with Google Ads and Shopify. eCommerce businesses can seamlessly monitor campaign performance through a user-friendly dashboard, create remarketing lists based on user behavior, and target users with relevant ads.
Additionally, GA4 enables the measurement of in-app and web conversions for various channels, including Google Ads, YouTube Ads, Facebook, and organic channels. This integration simplifies tracking the overall impact of marketing investments across different acquisition channels, leading to more targeted and effective ad campaigns.
Advanced Data Analysis with BigQuery Integration
Google Analytics 4 (GA4) offers seamless integration with BigQuery, a robust data analysis platform.
This integration enables eCommerce businesses to export raw data to BigQuery, facilitating advanced data analysis for deeper insights into website users and their behavior.
More Custom Dimensions
GA4 offers expanded capacity for custom dimensions, providing up to 50 event-related metrics, 50 custom metrics, and 25 user-related custom dimensions per property.
This flexibility allows for granular tracking and analysis of user interactions, enabling businesses to tailor strategies based on insightful data and optimize user experiences to drive conversions.
Understanding the Basics of GA4
GA4 is built on the foundation of flexibility and adaptability to future web environments. Understanding it is crucial for modern eCommerce businesses who will encounter complex user journeys that span multiple devices and platforms.
To effectively use GA4, it's essential to understand its core concepts.
Data Layer
In Google Analytics 4 (GA4), the data layer serves as a bridge between your website and the GA4 analytics platform. Essentially, it functions as a virtual layer of data that captures information from user interactions on your website.
The data layer is a JavaScript object used within web pages to store and pass information about various aspects of user interactions and website events. This includes tracking custom events and ensuring data consistency throughout your website.
It holds diverse information for your eCommerce store, ranging from basic metrics like page views and user demographics to more granular actions, such as button clicks or form submissions.
Its implementation is integral for providing the requisite information needed to construct precise eCommerce reports in Google Analytics 4.
Your Attribution Strategy with GA4
Attribution in GA4 refers to the process of assigning credit to various marketing channels or touchpoints for driving conversions. It employs a probabilistic model that considers factors like user behavior, time lag, and the sequence of touchpoints.
Essentially, Google Analytics 4 attributions help identify the channels or touchpoints that contribute the most to overall conversions. Touchpoints can be any interaction along the sales path. For instance, clicking on an email ad or arriving at the site via organic search.
In eCommerce, where the customer journey can involve multiple touchpoints like search ads, social media, and email marketing, understanding attribution is paramount.
It provides eCommerce store owners and marketers with a comprehensive view of the customer journey, enabling them to allocate budgets more effectively and focus on channels and campaigns that drive tangible results.
How GA4 Changes the Attribution Game
GA4 introduces several significant changes and improvements to attribution reporting. Here are its three attribution models you can choose from:
Data Driven Attribution (DDA) Model
The Data-Driven Attribution (DDA) model, default in GA4, employs a sophisticated algorithm to assign credit to various touchpoints along the user journey. Unlike traditional models, DDA integrates historical data from your account with advanced AI modeling to evaluate the impact of each channel accurately.
DDA considers diverse factors such as device types, ad interactions, exposure order, creative assets, and time to conversion. By analyzing these elements, it provides a nuanced understanding of each touchpoint's contribution to conversions.
It adopts a counterfactual methodology, comparing actual user behavior with hypothetical scenarios to identify touchpoints with the highest likelihood of driving conversions..
Unlike its predecessor in Universal Analytics, which analyzed only the last four touchpoints, GA4's DDA model evaluates over 50 touchpoints.
While DDA offers advanced attribution capabilities, its underlying algorithm complexity can pose challenges in understanding its functioning compared to simpler models. This complexity underscores the need for careful interpretation of results and ongoing refinement of attribution strategies.
Cross-Channel Rule-Based Model
GA4 also offers a cross-channel rule-based model that distributes credit among touchpoints based on predefined rules rather than algorithmic analysis.
These models operate on five distinct rules, each with its own attribution logic:
Linear: This rule evenly distributes credit across all touchpoints in the user journey, providing equal weight to each interaction.
Position-Based: Also known as the U-shaped model, this rule attributes the majority of credit to the first and last touchpoints, acknowledging their significance in initiating and finalizing conversions.
Time Decay: With this rule, credit is primarily allocated to the touchpoint closest to the conversion event. Touchpoints closer in time to the conversion receive more credit, reflecting the diminishing influence of earlier interactions.
First Click: As the name suggests, this rule assigns full credit to the first touchpoint in the user journey, emphasizing its role in capturing initial interest or awareness.
Last Click: Conversely, the Last Click model assigns full credit to the final touchpoint preceding the conversion, recognizing its immediate impact on driving the conversion action.
Ads Preferred Last Click Model
The Ads Preferred Last Click model operates similarly to the Last Click model discussed above but with a notable distinction. In this model, 100% of the credit is attributed to the last Google Ads channel clicked by users before conversion, irrespective of whether it was the actual last
touchpoint in the user journey.
For instance, consider an example involving Paid Search advertising. If a user interacts with various touchpoints before converting, the attribution would be as follows:
- Google search (0%) → Paid Search (0%) → YouTube video (0%) → Paid Search (100%) → Direct visit (0%)
However, if there are no Google Ads clicks in the conversion path, the model reverts to the cross-channel last click model discussed previously. It would be something like::
- Google search (0%) → Paid Search (0%) → YouTube video (100%) → Direct visit (0%)
Utilizing the Default channel grouping may not reveal substantial differences in the conversion paths report. Therefore, for Google Ads, employing Campaign as a dimension provides more contextual information.
It's essential to note that using this attribution model setting allows you to view conversions specifically attributed to Google Ads. Consequently, if you're advertising on other channels, the model may not display data for those platforms, potentially leading to the misconception that they are less effective.
Developing an Attribution Strategy for Your Business
Imagine this: A customer finds your website through a Google search. Then, they see your social media posts and return to your site. They sign up for your email list and finally make a purchase by clicking a link in your email. Who gets credit for this sale?
This is where attribution comes in. It helps you answer this question by assigning credit to each touchpoint, helping you understand the value of your marketing efforts.
Why Attribution Matters
A decade ago, the way people used to shop was incredibly simple: visit a store, see a product, and buy it. But technology has completely changed the way we shop. It has made our lives more interconnected than ever.
Today, the buying journey has become quite complex. For every online sale, there are around 56 touchpoints. This complexity makes it very difficult to understand and measure the impact of any digital marketing activity on revenue.
In today's multichannel world, knowing the value of each marketing channel is vital. Reliable reporting helps identify what's working and what’s not.
Here are some specific reasons why attribution matters:
Optimize Marketing Spend
Attribution helps identify which channels contribute most to conversions, allowing you to allocate your marketing budget more effectively. For instance, if you find that paid social media ads generate more conversions than email campaigns, you can adjust your budget accordingly to maximize ROI.
Improve Customer Experience
Understanding the customer journey through attribution enables you to optimize touchpoints and create a more personalized experience.
For example, if you discover that customers frequently engage with your social media posts before making a purchase, you can tailor your content to better meet their needs and preferences. This leads to increased customer satisfaction and loyalty as customers feel understood and valued by your brand.
Inform Strategic Decisions
Attribution insights provide valuable data for making informed strategic decisions. By understanding how different channels contribute to conversions, you can adjust your marketing strategies to better align with customer behavior and preferences.
If you find that mobile users have a higher conversion rate than desktop users, you can prioritize mobile optimization and invest more resources in mobile advertising to capitalize on this trend.
Measure Campaign Performance
Attribution allows you to accurately measure the effectiveness of your marketing campaigns. By attributing value to each touchpoint, you can assess the performance of individual campaigns and identify areas for improvement.
If a particular email campaign generates a high number of clicks but low conversions, you can analyze the content and messaging to identify potential reasons for the discrepancy and make adjustments accordingly.
Understanding Different Attribution Strategies
Let’s take a deep dive into some common attribution strategies:
First-Touch Attribution
In this model, the first interaction a customer has with your business receives full credit for the conversion.
For instance, if a customer signs up for your newsletter before making a purchase, your email marketing efforts get all the credit.
It's best used to identify the initial touchpoints that bring in new leads or when you're just starting to build your marketing funnel. However, it's not suitable for longer sales cycles where multiple touchpoints influence the buying decision.
Last-Touch Attribution
This model attributes all credit for a conversion to the last touchpoint the customer interacted with before making a purchase.
If a customer finds you through organic search, visits your page by clicking your post on social media, and finally clicks on a Google ads and then buys the product, the Google ad gets all the credit due to it being the last touch before the conversion.
It may be useful for businesses with straightforward sales funnels where the final touchpoint is the most critical in driving conversions. It's often used in eCommerce businesses with short sales cycles.
The idea is to understand high-impact touchpoints at the bottom of the sales funnel but may not be suitable for complex customer journeys with extensive research before purchase.
Time Decay Attribution
In time decay attribution, touchpoints closer to the conversion are given more weight, assuming they had a greater impact on the sale. This model recognizes that touchpoints closer to the conversion are likely more influential.
It's ideal for businesses with shorter customer journeys (<90 days) and helps determine which touchpoints drive conversions.
However, it may not be suitable for longer B2B sales cycles where decisions are made well before the final touchpoint.
Linear Attribution
This model assigns equal credit to all touchpoints along the customer journey, assuming each contributes equally to the conversion.
It's useful for understanding consistent channels across the buyer's journey but may not provide insights into the most critical touchpoints.
Linear attribution is beneficial when you want to give equal credit to all touchpoints, regardless of their position or timing in the journey.
A Framework for Creating an Attribution Strategy
Here are some tangible steps you can take to define your attribution strategy:
Define Your Goals
Start by clarifying your business objectives and what you aim to achieve with your marketing efforts. Are you focused on increasing sales, generating leads, boosting brand awareness, or driving website traffic? Your attribution strategy should align with these goals and provide insights into which channels are most effective in achieving them.
Understand Your Customer Journey
Analyze the typical path customers take from initial interaction to conversion. Identify the various touchpoints they encounter along the way, including organic search, paid ads, social media, email marketing, and direct visits.
Understanding the customer journey will help you determine which channels play significant roles at different stages and where to allocate attribution credit.
Choose the Right Attribution Model
There are several attribution models available in Google Analytics 4, each with its own approach to assigning credit to touchpoints. Common models include Data-Driven Attribution, Linear, Time Decay, First Click, Last Click, and Position-Based.
Select a model that best reflects your business objectives and provides actionable insights into channel performance.
Test and Iterate
Implement your chosen attribution model and monitor its performance over time. Test different models to see which one provides the most accurate representation of your customer journey and aligns with your business goals.
Continuously iterate and refine your attribution strategy based on new insights and changes in consumer behavior.
Incorporate Multi-Touch Attribution
Recognize that most conversions involve multiple touchpoints, and no single channel operates in isolation.
Adopt a multi-touch attribution approach that considers the contributions of all channels throughout the customer journey. This holistic view enables you to assess the cumulative impact of marketing efforts across various touchpoints.
Utilize Custom Attribution Models
In addition to predefined attribution models, leverage custom attribution models tailored to your specific business needs. Develop custom rules or algorithms that reflect the unique characteristics of your industry, target audience, and marketing channels. Custom models provide greater flexibility and accuracy in attributing conversions.
Analyze and Act on Insights
Attribution isn’t a “set it and forget it" process. Regularly analyze attribution reports to gain insights into channel performance, customer behavior, and conversion paths.
Identify high-performing channels and allocate resources accordingly to maximize ROI. Use attribution insights to optimize marketing campaigns, refine messaging strategies, and improve the overall customer experience.
Convincing Stakeholders of the Value of Your Attribution Strategy
Now that you understand attribution and its different models and have a robust strategy in place, it’s now time to convey the value of your robust attribution strategy to the stakeholders.
Here are 5 tactics you can employ:
Demonstrate Return on Investment (ROI)
Show stakeholders how implementing an attribution strategy can lead to better allocation of resources and improved ROI. Provide concrete examples of how attribution allows you to identify the most effective marketing channels and allocate budget accordingly.
Present data illustrating how attribution insights have resulted in increased conversions, higher revenue, and improved overall marketing performance.
Prepare Case Studies
Provide case studies or examples from similar businesses or industries that have successfully implemented attribution strategies. Highlight the specific challenges these businesses faced and how attribution helped them overcome these challenges to achieve positive results.
Share metrics such as increased conversion rates, higher customer engagement, and improved customer satisfaction as evidence of the effectiveness of attribution strategies.
Highlight Competitive Advantage
Emphasize how having a sophisticated attribution strategy can give your business a competitive edge. Showcase how attribution enables more informed decision-making by providing valuable insights into customer behavior and preferences.
Start Small with Pilot Projects
If stakeholders are hesitant about implementing attribution strategies, propose starting with a pilot project or small-scale implementation. Use this opportunity to demonstrate the value of attribution in a controlled environment.
Present a detailed plan outlining the objectives, methodology, and expected outcomes of the pilot project. After successful implementation, showcase the positive results achieved through attribution insights to gain buy-in for larger-scale implementation.
Educate and Collaborate
Educate stakeholders about the importance of attribution and involve them in the decision-making process. Collaborate with stakeholders to define key performance indicators (KPIs) and goals for your attribution strategy.
Once you start the project, provide regular updates and reports on the progress and impact of attribution initiatives to keep stakeholders informed and engaged.
By fostering a collaborative approach and demonstrating tangible results, you can gain the support and commitment of stakeholders to your attribution strategy.
Importance of Self-Reported Attribution
Self-reported attribution involves directly asking customers which touchpoints influenced their decision-making process. While not as accurate or objective as data-driven attribution models, self-reported attribution can provide valuable qualitative insights into customer behavior, preferences, and perceptions.
It can help fill in gaps where data may be lacking and provide a more holistic understanding of the customer journey. Additionally, incorporating self-reported attribution into your strategy demonstrates a commitment to customer-centricity and can improve trust and engagement with your audience.
However, it's essential to use self-reported attribution alongside data-driven models for a comprehensive understanding of the customer journey.
Setting Up Google Analytics 4
It’s now time to understand how to use the platform. If you already had an account with the previous version, you wouldn’t be required to create an account.
If you didn’t, here’s how you can create an account:
Create a GA 4 Account:
If you're new to Google Analytics, visit the Google Analytics homepage and click on the “Start Measuring” button. This will take you to the “Account Details” page.
- Account Name: Provide a name in the “Account name” box. Use your domain name if you're analyzing only one domain.
- Data Sharing Settings: Choose the account data-sharing settings according to your preferences.
- Set Up Property: Enter your website URL as the “Property name” and set the “Reporting time zone” and “Currency”.
- Add Business Details: Answer a few questions about your business and state your Google Analytics objectives.
- Sign Terms of Service: Accept the Google Analytics 4 terms of service.
Set Up a Data Stream
In Google Analytics 4, you can include both web and app data in the property settings.
Web Data Stream: Click on the “Web” button, add your URL, and provide a “Stream name”.
Enhanced Measurement: It's recommended to leave this option turned on for collecting on-page data like “video views” and “downloads”.
App Data Stream: Click on “Android” or “iOS” based on the type of app you want to monitor. Fill out the required details for the app you're registering.
Register App: Download the config file for your app, add the Google Analytics for Firebase SDK, and run the app to confirm the installation and communication with Google servers.
By following these steps, you'll successfully set up Google Analytics 4 (GA4) and be ready to track data from your website and app.
Adding GA4 to Your Website/App
For Websites:
- After creating a data stream for your website, you'll receive a "Measurement ID" (formatted as G-XXXXXXXXXX).
- You can implement this ID directly into your website's code or use Google Tag Manager for a more flexible setup.
For Apps:
- Follow the detailed setup instructions provided by GA4 for iOS or Android apps. This usually involves adding SDKs to your project and configuring them with your GA4 property ID.
Implementing GA4 with Google Tag Manager
Create a New Tag: In Google Tag Manager (GTM), go to your container and create a new tag.
Tag Configuration: Select "Google Analytics: GA4 Configuration" as the tag type. Enter your Measurement ID.
Triggering: Choose the trigger that will fire this tag. For basic pageview tracking, select the "All Pages" trigger.
Publish: Save your tag, submit your changes, and publish the container.
Verification and Troubleshooting Common Issues
- Real-time Data: After setup, visit your site, then check the "Real-time" report in GA4 to see if the data is coming through. This is the first and most straightforward verification step.
- DebugView: DebugView helps you see visitor data in real-time so you can check if your users are navigating through your domain and completing events.
It also tells you whenever your website visitors view errors or warnings. This helps you understand the problematic parts of your website.
Ensure you have debug mode enabled in your app or use the GA4 Debug Extension for Chrome when testing web implementations.
Common Issues:
- Data Not Appearing: If data isn't appearing in your reports, double-check your Measurement ID and ensure it's correctly implemented on your site or app. In GTM, verify that the correct triggers are set.
- Mismatched Data: Discrepancies between GA4 and UA or other analytics tools can often be attributed to differences in how sessions are defined or how events are tracked. Review GA4's documentation to understand these differences.
- Tag Configuration Errors: In GTM, ensure that your GA4 Configuration tag is firing correctly and that any event tags are correctly configured with the right parameters and triggers.
Transitioning to GA4 and mastering its new features takes time, but by following these steps, you'll set a solid foundation for advanced analytics tracking.
Remember, GA4 is designed to be future-proof, adapting to new privacy regulations and changes in user behavior, making it a valuable investment for your digital strategy.
Advanced GA4 eCommerce Tracking Techniques
The dynamic nature of marketing requires staying on top of evolving tools and practices. With that in mind, let's dive into setting up Google Analytics 4 (GA4) for tracking your eCommerce transactions, all while maintaining a close eye on accuracy and clarity.
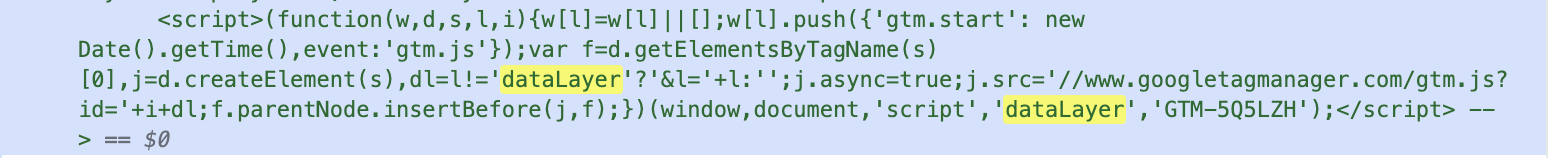
Begin by making a demo purchase on your website. Then, inspect the source code by right-clicking your browser, selecting “inspect” and looking for the "data layer" to ensure all transaction details are correctly captured. This step is crucial for verifying that your data layer is properly set up to relay transaction information.
Head to Google Tag Manager and select the 'Tags' section. Here, your task is to create a new tag for transmitting purchase details to GA4. Click on 'New' to proceed.
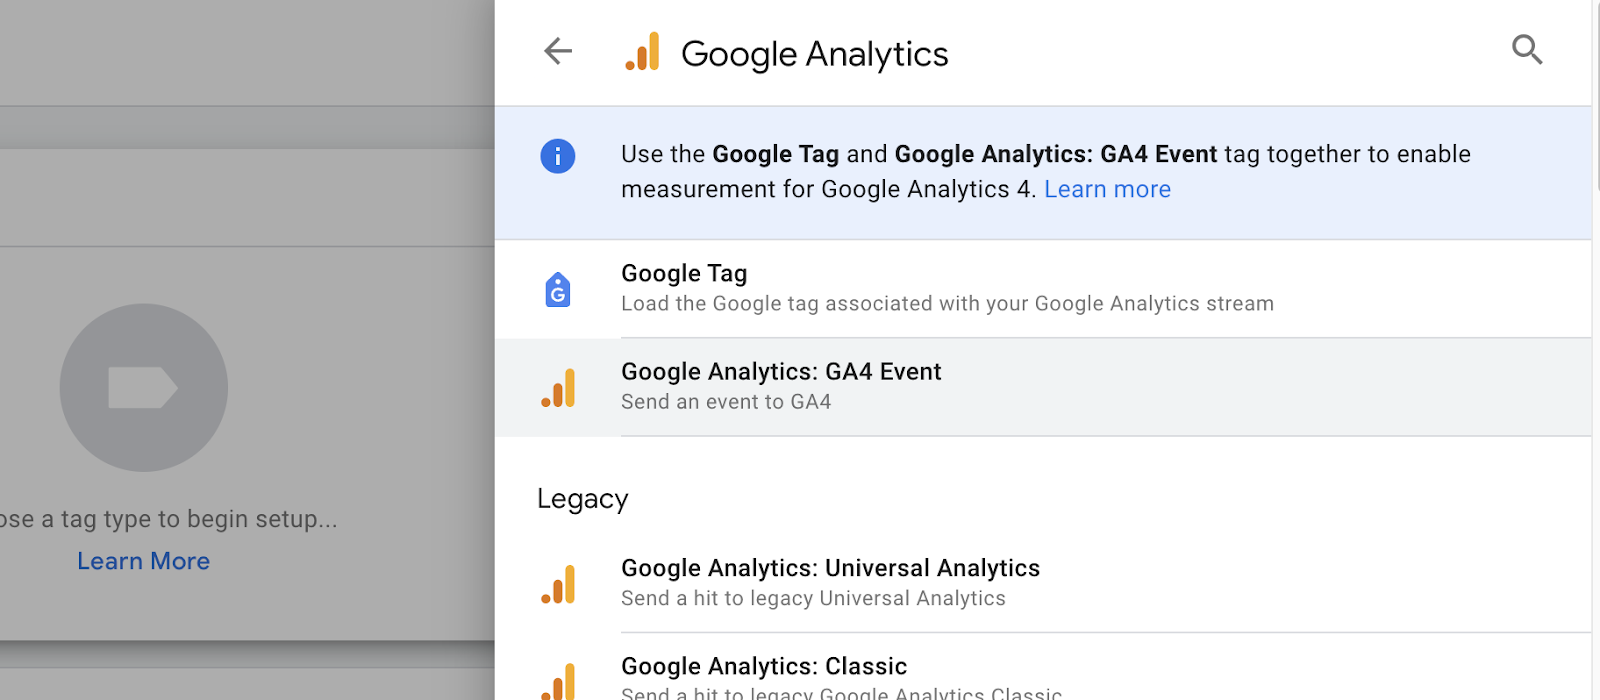
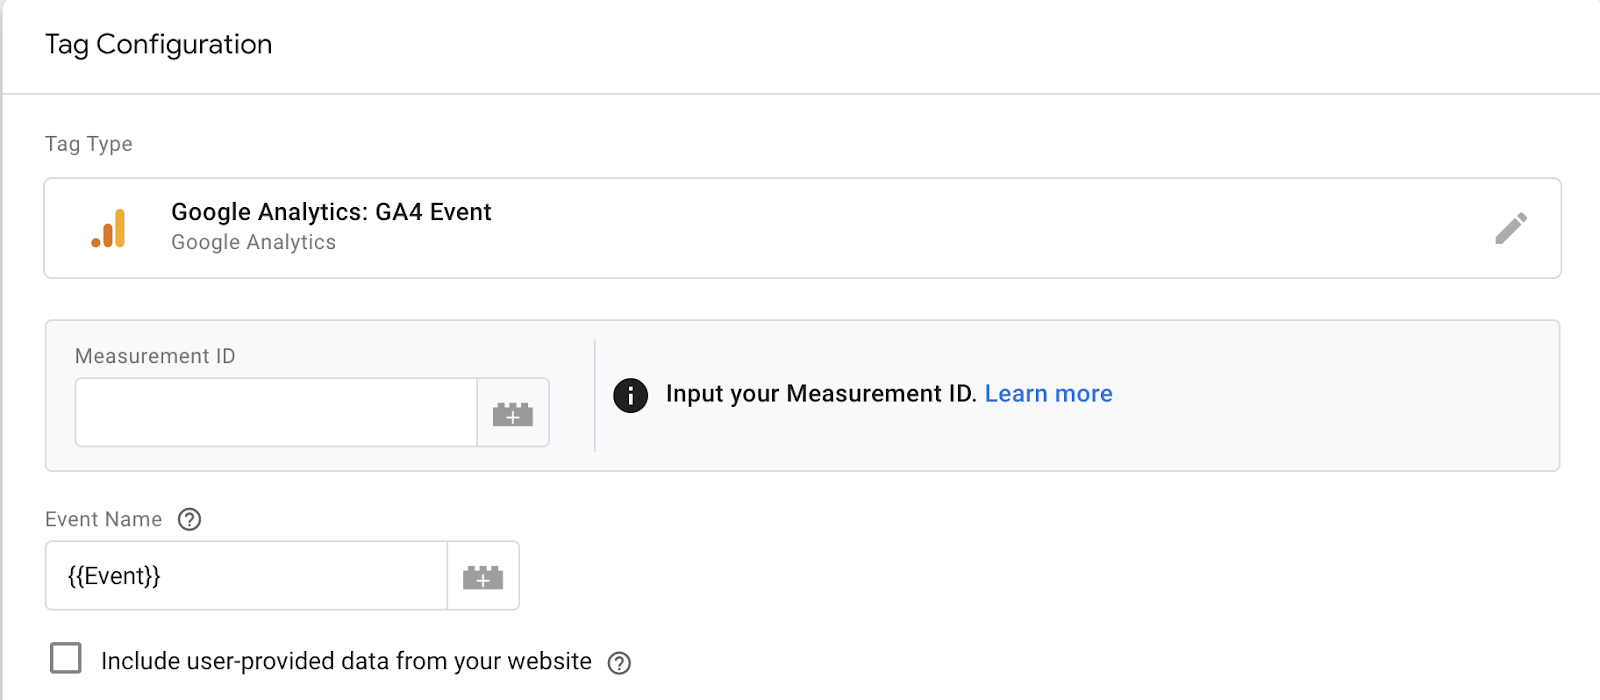
Name your new tag, then choose 'Tag Configuration' and select 'GA4 Event' as your tag type. This step is vital for categorizing the tag correctly within GA4.
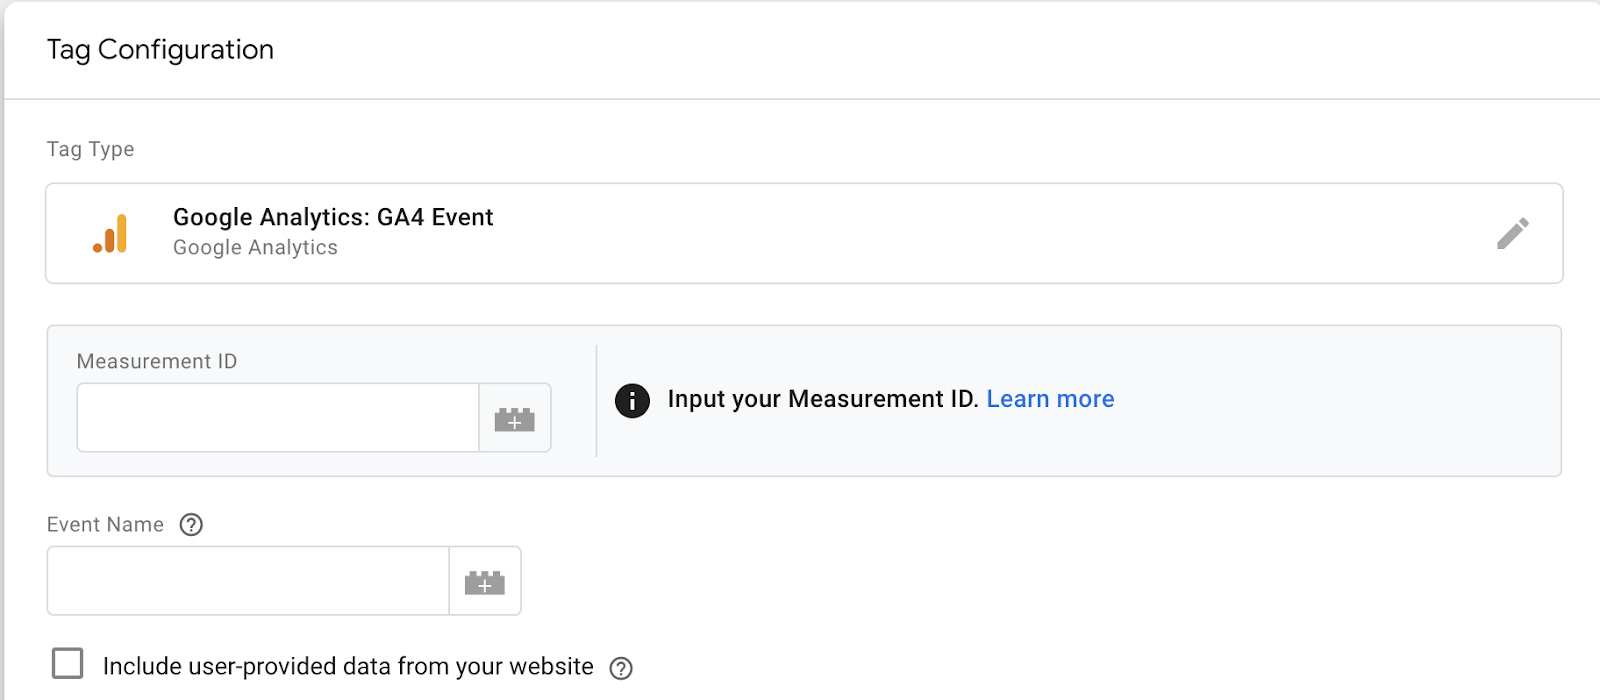
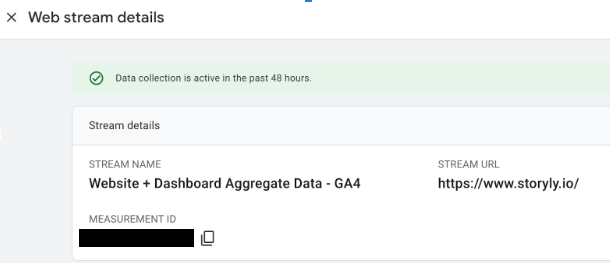
Put your Measurement ID from your GA4 property. Admin > Data Streams > “select your stream.” In the stream details tab, you’ll see your measurement ID. This ensures your new tag is connected with your overall GA4 conversion tracking.
Click on the variable icon under 'Event Name' and choose 'Event.' This action will enable the name of the data layer event to be passed into your tag, ensuring accurate tracking.
In the 'More Settings' section of your tag, activate the “Send eCommerce data” option. Make sure 'Data Layer' is chosen in the dropdown menu. This step allows the automatic collection of eCommerce details from your data layer, sending them to GA4 with the event.

Click on the pencil icon in 'Triggering' to add a trigger to your tag. This trigger will be responsible for activating your tag during eCommerce activities. Use the blue plus sign to create a new trigger.
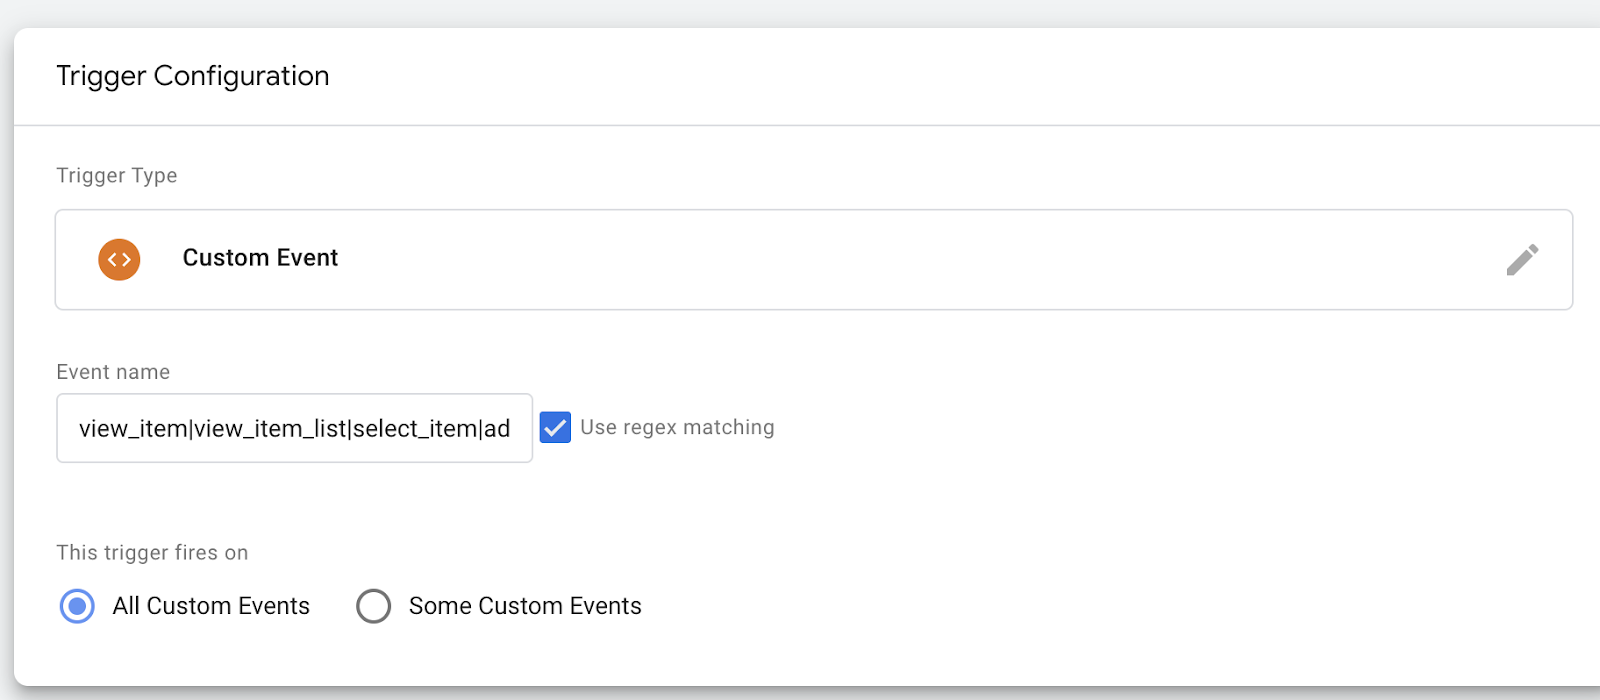
Name your trigger and select 'Trigger Configuration.' Scroll down to find 'Custom Event.' Here, input the data layer event names that will activate your tag. Google provides a list of recommended events like 'view_item', 'add_to_cart', etc. You can use regular expressions to fine-tune which events trigger your GA4 event.
Using the following event name would be a good start:
“view_item|view_item_list|select_item|add_to_cart|remove_from_cart|view_cart|begin_checkout|add_payment_info|add_shipping_info|purchase”
After setting up the trigger, save both the trigger and the tag.
Before going live, preview your tag. Click 'Preview', enter your store's URL, and select 'Connect.' This step allows you to test the functionality in a controlled environment.
Add an item to your cart and complete a purchase. Then, in the Tag Assistant tab, select the purchase event and the corresponding tag. If everything is set up correctly, you'll see the transaction details in your Google Tag Manager.
Finally, check the setup in Google Analytics 4. Navigate to 'Configure' > 'Debug view' to see if the purchase event is correctly reported in your GA4 property.
Remember, setting up your GA4 with accurate eCommerce tracking is a key step in utilizing the power of data for strategic decision-making. This comprehensive setup ensures you're not just collecting data but also able to translate it into actionable insights for your business.
Event Tracking in GA4: A Deep Dive
In the dynamic world of analytics, understanding user behavior is key to the success of any online experience. With the introduction of Google Analytics 4 (GA4), event tracking has undergone a significant transformation, offering more flexibility and depth in capturing user interactions. I’ll try to help you with everything related to event tracking in GA4 from the actual implementation of events to creating reports and funnels with them.
In Google Analytics 4 (GA4), the data layer is a fundamental component that acts as an intermediary between your website and GA4. It's essentially a virtual layer of data that captures information from interactions on your website. Deploying a well-structured data layer is crucial as it ensures the accurate and efficient transmission of data to GA4.
The data layer is a JavaScript object used to store and pass information about user interactions. This could be anything from page views, user demographics, and eCommerce transactions to more specific actions like button clicks or form submissions.
Types of Events in GA4 and Their Significance
GA4 introduces a more flexible and comprehensive approach to event tracking, moving away from the rigid category-action-label structure of Universal Analytics.
Automatically-Collected Events
These events are tracked automatically by GA4 once the tracking code is installed. They include basic interactions like page views, scrolls, outbound clicks, site search, and video engagement.
Enhanced Measurement Events
By enabling enhanced measurement in GA4 settings, you can track additional interactions like file downloads, video plays, and site search without any additional code.
Recommended Events
GA4 recommends certain events based on your industry type (eCommerce, travel, etc.). These events aren't automatically tracked but follow a predefined structure, making them easier to set up and ensuring compatibility with GA4's reporting features. Above, I showed you how to do that.
Custom Events
For specific tracking needs not covered by the above categories, you can create custom events. These require modifying your website's code or using Google Tag Manager to push events to the data layer. In order to have some freedom in your event tracking, understanding custom events is important. A user’s interaction creates a lot of track (of course pun is intended) for us to track.
You can create custom events thanks to these “tracks” left by users. For example, if you like to track a user’s interaction with Storyly Stories, you can create a custom event called “story_group_clicked.” Let’s see how they are easily created via Google Tag Manager.
Step-by-Step Guide to Creating Custom Events in GA4
Step 1: Identify the Event to Track
Before you start coding or configuring anything, clearly define what user interaction you want to track. This could be anything from a button click or a form submission to more complex interactions like feature usage. My rule of thumb here is to understand what you can track and what you need. A lot of actions trigger something in the data layer, think about what actions create trackable information and how many of them you actually need.
Having too few events is obviously bad because you may not create insights from too little information. On the other hand, having too much information creates chaos. However, I always try to be more generous than needed as historical tracking is impossible with events. So, it's better safe than sorry.
Step 2: Plan Your Event Parameters
Each event can have parameters, which are additional pieces of information that describe the event in more detail. Decide on what parameters (like 'value', 'item_id', etc.) are relevant to your event. This is important because information without detail is just data and data by itself is, in most cases, useless. List the parameters you may need in front of events. For example, for the story_group_clicked event, event parameters may be “story group name” and/or “story group id.” For the add_wishlist event, it is “item_id”, “item_name”, or even maybe “item_price”. Try to be as precise as possible with event parameters as they will help you differentiate user behavior in more detail.
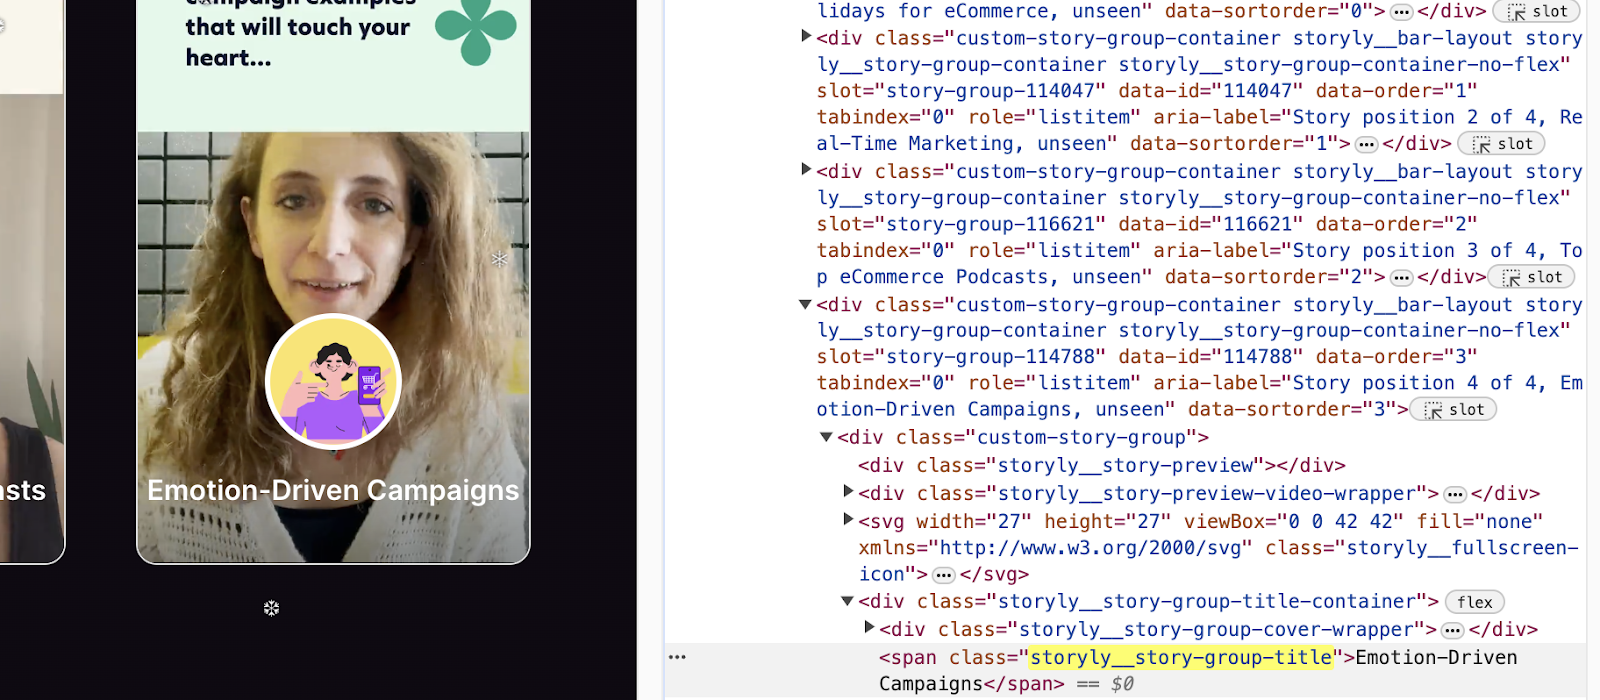
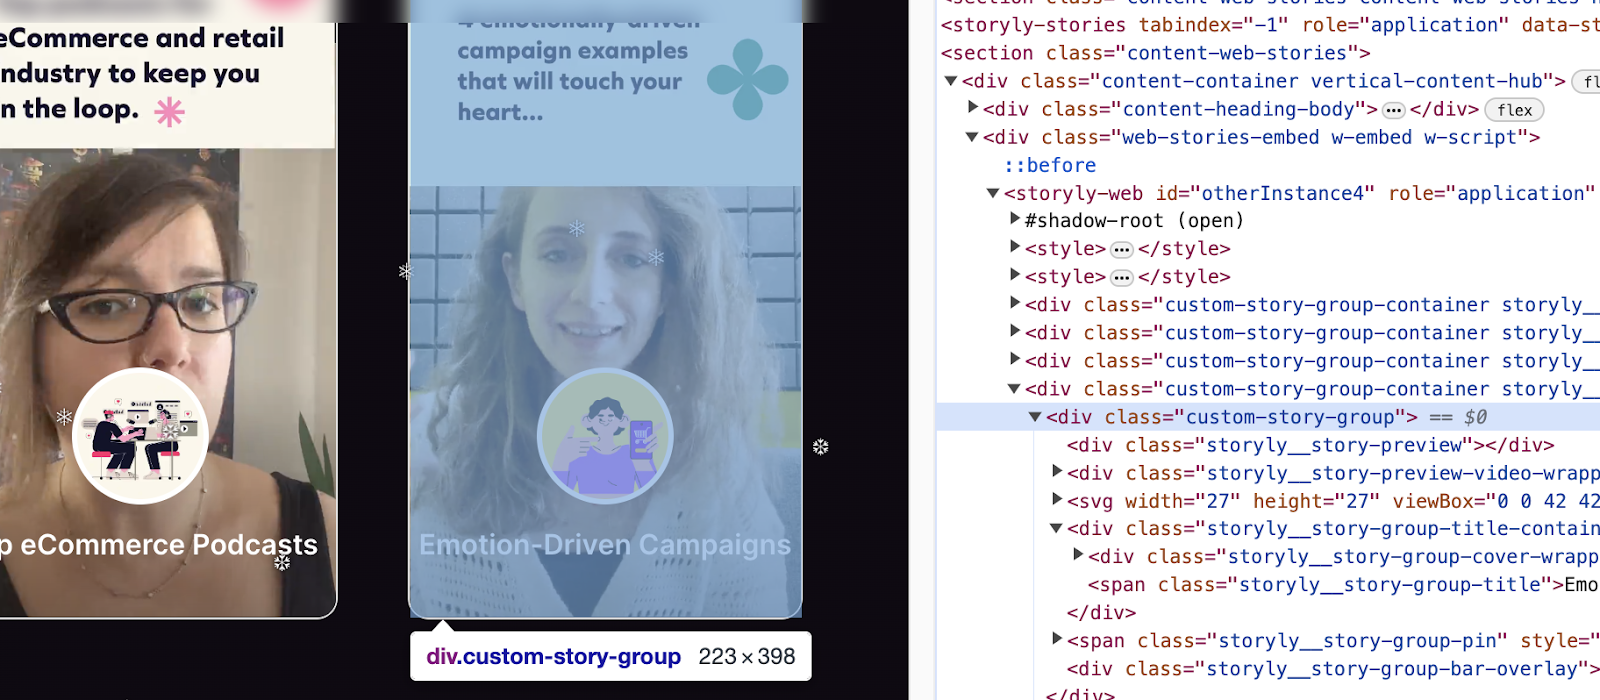
To create an event parameter, you need to create variables. In Google Tag Manager, go to variable and click the blue plus sign. For almost any case, creating a variable method may be different. Let’s create an event parameter and relevant variable for Storyly Story Group names. Storyly Stories, when clicked, change the CSS selector. Hence, we can find the CSS selector that has the name of Story Groups and assign it as a variable.
Go to your webpage with Stories and click inspect from the right click menu. After enough digging, you’ll see the name you’d given the Story group. Note its class name, in this case, it is “storyly__story-group-title”.
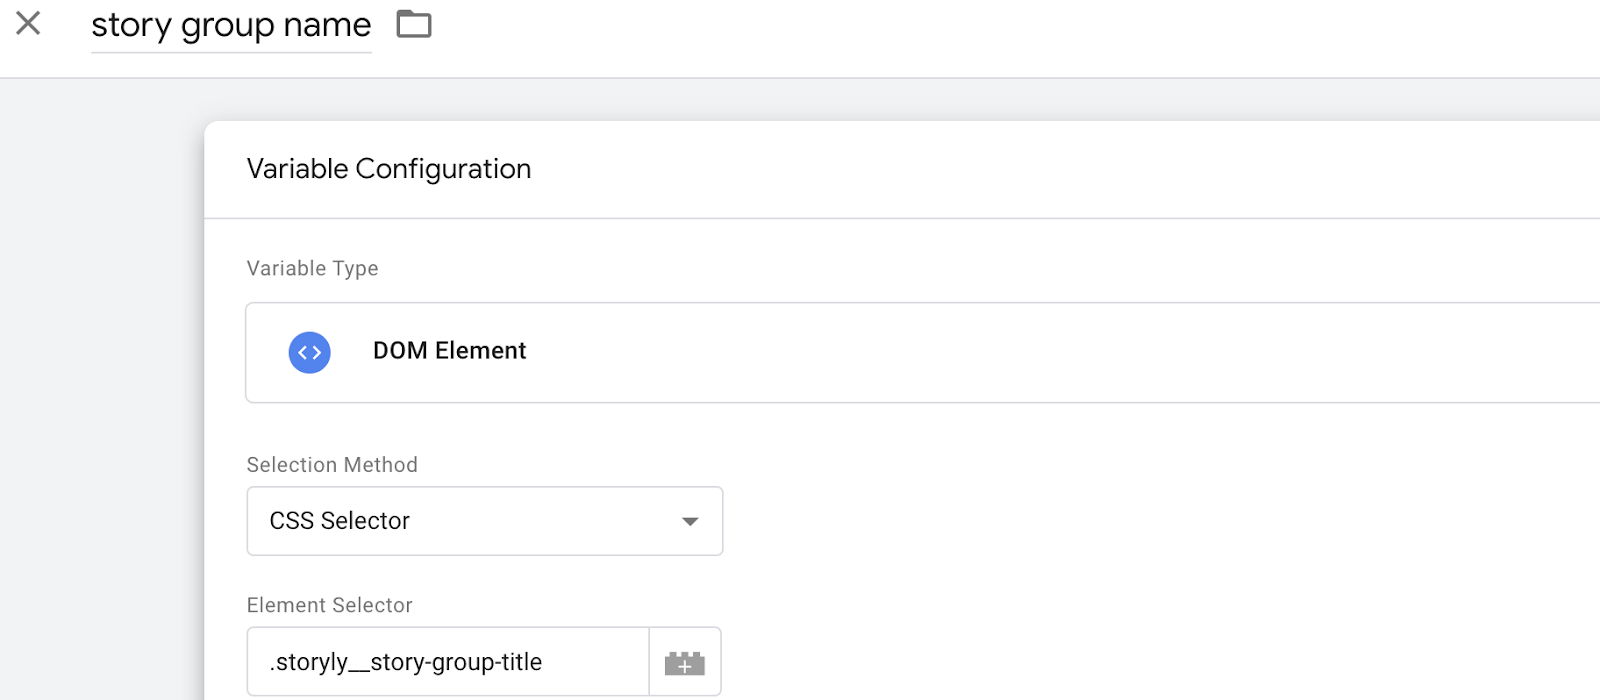
Go back to Tag Manager and in Variables, click the Blue Plus sign. From the Variable type select DOM Element. The selection method is CSS Selector. In the Element Selector field put the class name you’ve found with a dot in front of it, as we are trying to select a CSS element here. Click save.
Now, go back to Tags. Click New. Choose GA4 Event and put your measurement ID. Give this event a name. In our case, it is “story-group-click”. Select event parameters. For the first parameter name, write “event_label” and for its value click the plus sign on the field and find the parameter you’ve just created.

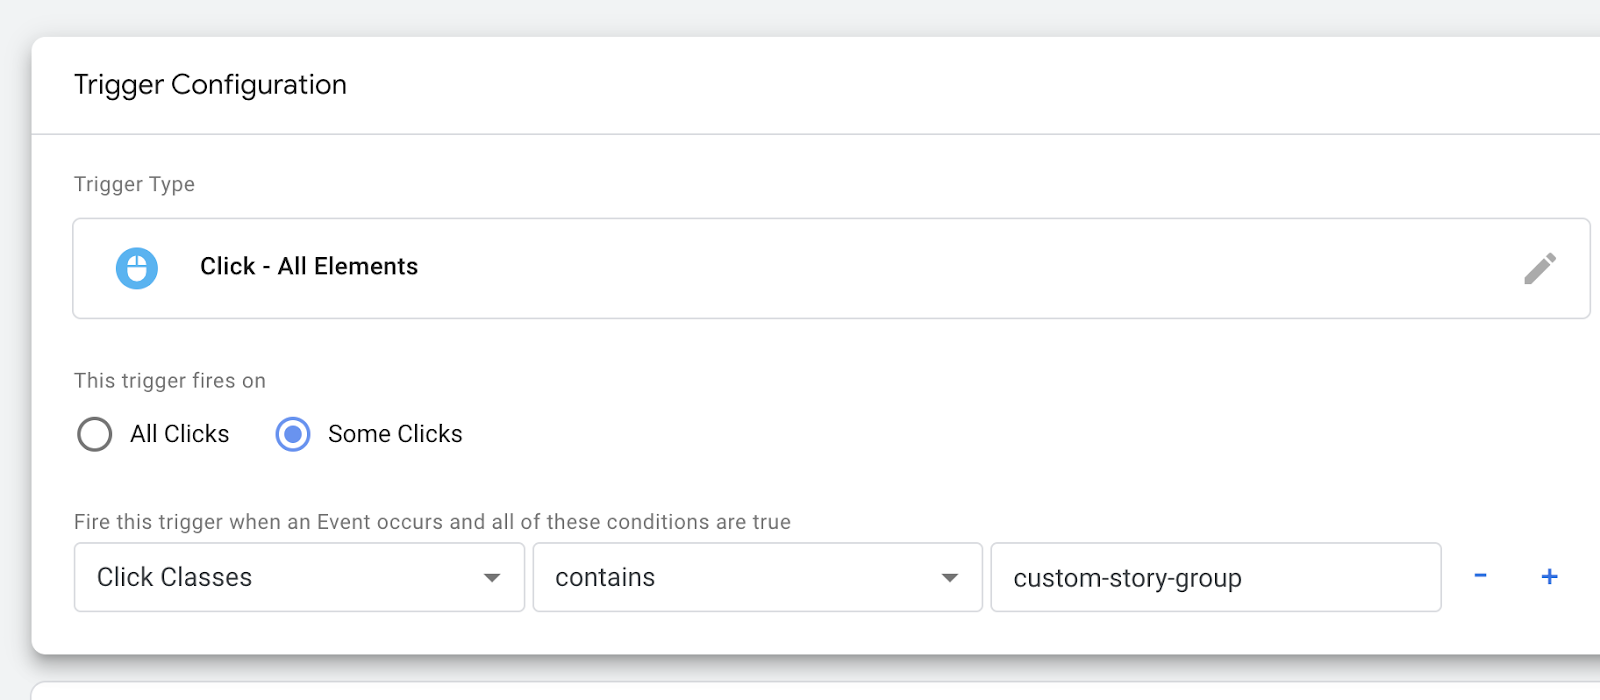
Now, let's deal with this tag’s trigger. Select the Triggers below. Choose Click All Elements. Select Some Clicks from the radio button menu. Now from the new options, you have to give the detail on the click class of the element, in this case, Story Group’s class has the value “custom-story-group”.
Click Save for the trigger and click Save for the tag.
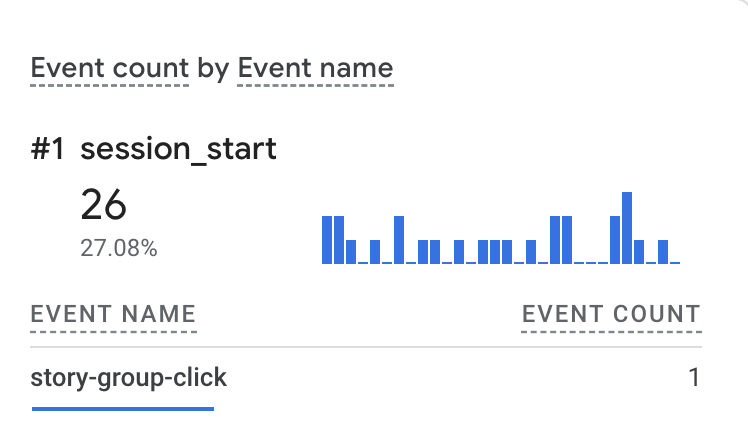
Click Submit for all the changes you have made in Google Tag Manager. And Check the GA4 Realtime page, event name tab to see.
Click the event label after clicking the event name to see the parameter information we have put there.

Step 3: Set Up Event Tracking in Your Website's Code
Setting up custom events is not entirely different than setting up recommended events. But for this case, we need to understand what triggers that event and what changes in the code. Use Google Tag Manager for this again.
Create a New Tag
Go to your GTM account, click on 'Tags' → 'New' → 'Tag Configuration' and choose 'Google Analytics: GA4 Event'.
Configure the Tag
Enter your GA4 Configuration Tag (or GA4 ID), and define the 'Event Name' and 'Event Parameters'.
Now, you need some code surveying to detect the trigger. If you despise the codes you are seeing, you can always use ChatGPT! Try to copy the HTML body of the part you want to configure tag and trigger and say “Give the relevant class/ID for me to trigger this action in Google Tag Manager”. It will give you just thing. Don’t forget to double-check it!
Set Up a Trigger
I’m going to give some examples for this but in general, you define what action on your website will trigger this tag. This could be a click, form submission, etc.
Go to triggers and click new. You can configure this trigger as 'Click' - 'All Elements' for tracking all clicks, or 'Just Links' for link clicks. Let’s say you want it to trigger on a button click. Set conditions to specify when the trigger should fire. For instance, you might want to fire the trigger when the 'Click ID' or 'Click Class' equals a certain value corresponding to your button. Save it, and link it with a tag if you didn’t do so.
Please follow how I create a “story_group_clicked” event with “story_name” parameters and relevant triggers.
Test Your Tag
Use GTM's 'Preview' mode to test if the tag fires correctly when the defined action occurs. If it fires when you do the intended action, you can publish that event.
Step 4: Verify Event Tracking in GA4
After implementing the event, you should verify that it's being tracked correctly in GA4.
In GA4, navigate to the 'Real-time' report to see if your event is being tracked when the defined action occurs. GA4's 'DebugView' tool is also helpful for monitoring and debugging event data in real time.
Integrating Storyly with GA4 for Enhanced Tracking
The marketing landscape is always praised for its dynamic, ever-changing nature. A thing you use daily for a long time might change completely overnight. The solution is simple. You get up, find a new way, and hope it lasts a little longer. In most cases, the problem is the same - low conversions, low budgets, high expectations, but the solutions seem to differ depending on how you look at it. In this constantly evolving landscape, the sustainable growth problem is almost always addressed by understanding and analyzing revenue streams.
This is where Google Analytics 4 comes into play. The previous version we had been using for a long time “evolved” and made me a very sad marketer for a couple of weeks, but now, seeing its capabilities for tracking and interpreting all kinds of data, I started to feel “regular” again, maybe with an edge in strategic decision-making, thanks to its revenue tracking and other abilities.
Think of revenue tracking in GA4 as your window into the world of your customers. It's not merely about counting sales; it's about discovering the 'whys' and 'hows' behind customer behaviors, purchasing patterns, and what makes your marketing tick during all these evolutions. When you blend GA4 with your website and other platforms you are using, you gain access to valuable user interaction and transaction data. This isn't just numbers and graphs; it's the story (pun is intended in all seriousness) of your business's growth and opportunities waiting to be seized.
A critical aspect of revenue tracking is understanding the contribution of other tools and platforms, such as Storyly, which can significantly influence purchasing decisions. Tracking revenue generated through us is vital for comprehensively understanding your revenue streams.
Integrating GA4 reporting with Storyly, for example, allows you to see how much revenue can be attributed to the interactions and engagements facilitated by Storyly. This integration enables you to measure the effectiveness of these Stories in driving sales, providing valuable insights into customer preferences and behaviors. By analyzing this data, you can fine-tune your content strategy on Storyly and other similar platforms to maximize revenue generation.
This is the most important part. I stand behind my word. Marketing is changing, evolving, hard, and soul-crushing. No matter how you want to put it, the high-level problem is always the same: if something goes in, it has to bring positive ROI. So, revenue tracking is crucial here.
Step-By-Step Guide on Setting Up Revenue Tracking Specific to Storyly Within GA4
From this part onwards, I’m assuming that you have installed Google Tag Manager, Google Analytics 4, and some recommended events. Revenue tracking is a delicate subject where there are good practices and bad practices but never a wrong one. The best way to stay on the right lane is to decide about your attribution strategy and the way you are collecting info.
Identify the events that will help you create seamless revenue tracking. The worst thing you can do is to have unknown unknowns, so try to be as specific as possible in terms of events. Here are some examples:
- View Item
- Add to Cart
- Add to Wishlist
- Begin Checkout
- Purchase
I’d also add some events to track the users’ activity around Storyly. Such as:
- Clicked on a Story Group
It is also important to track conversions to gain insights. Conversions are just the event you have marked as super-important. The purchase event would be a nice start for conversion tracking. From the admin panel in GA4 (Gear icon on the lower left) click on property settings > data display > events. From there you can see your events. There is a slide to mark them as conversions for each of them, you can easily mark your events as conversions from there.

For example, I created an event called story-group-click and it is important for the user journey I’m planning. So, I can mark it as a conversion and create reports around it. Having the purchase event as the conversion helps in eCommerce tracking as you can assign monetary values to these events (i.e. the amount of items purchased). However, you can also mark other events as conversions that cannot be assigned a monetary value such as using a promotional code, etc.
I would test and verify my events and conversions in their first 1-2 weeks to make sure they are firing correctly and filling my reports.
The easiest way to do so in GA4 is to go to Configure and Debug View. Whenever you trigger an event from your session, you can check if it is coming to GA4 or not.
Best Practices for Revenue Attribution: Event-Based Tracking and Session-Based Tracking
Attribution has always been an issue for marketers, whenever there is a nice way to shed a light on a customer’s path, a new privacy policy pops in and turns off that light. Like it is not enough, everyday we are witnessing new touchpoints across different channels for people to purchase.
Attribution revenue is no different. In order to understand whether a user seeing (or better, clicking) Stories affects their purchase decision, you have to acknowledge Storyly's involvement in the customer's journey.
There are two main tracking schools of thought about that. There is no correct answer in that sense, so you have to choose the one suited for your particular case. I’ll try to be as descriptive as possible.
Event-Based Tracking
Tracking based on events means you match users with predefined tags and track their progress through events' trigger states. This type of tracking has become the norm thanks to Google Analytics 4’s takeover. In the past, we tracked User IDs and their behavior through each user’s interaction with the website. However, now, we are tracking events triggered by users. For example, with event-based tracking, we are counting the “page_view” event to see a particular page’s click count.
This way of thinking helps when there is an interactable element on the web page and you want to track its impact on the purchase funnel. For instance, adding an item to a wishlist is tracked by the add_wishlist event. You are already tracking item_view, add_to_cart, begin_checkout, and purchase events. So, you can actually create a funnel report and directly measure the impact of adding an item to the wishlist on the purchase decisions of the customers.
See where this is going? Event-based tracking helps you capture specific interactions like the ones with Storyly Stories. Imagine you have an event called story_group_click. You can derive insights like “From all purchase events, %60 percent of these also share the story_group_click event”. That means 6 in 10 purchasers actually clicked on a Story group. Let’s keep it simple and assume that the story_group_click event has a 60% contribution to purchase events. Imagine that 10 purchases worth 1000 dollars, we can say Stories contributed 600 USD in that given time period. You can calculate the ROI from there.
The real-time nature of event-based tracking also helps you make timely decisions and optimizations. However, the main downside is that with enough time and content, you’ll have hundreds of events that you try to make sense of.
Session-Based Tracking
Session-based tracking is a methodology where user interactions are aggregated and analyzed based on sessions. Unlike event-based tracking, which focuses on specific actions or events triggered by users, session-based tracking provides a broader view of a user's journey on a website or application within a given timeframe.
In session-based tracking, a session typically starts when a user enters a website and ends when they leave or after a period of inactivity. This approach used to be a standard before the advent of event-based tracking, like in older versions of Google Analytics.
Consider this: In session-based tracking, we are less concerned about individual events like "page_view" or "add_to_cart." Instead, we focus on the entire sequence of a user's interaction within a session. For example, if a user visits a website, browses through different products, adds some to their cart, and then makes a purchase, all these activities are captured as part of a single session.
This approach is especially useful when you want to understand the overall user experience and behavior patterns on your website. For instance, if you notice that sessions involving visits to a particular page often lead to higher engagement or conversions, you can infer that the page effectively drives user interest.
Let’s apply this to an e-commerce scenario. Imagine you are tracking sessions that include views of a special offer banner. You might find that 40% of the sessions that involve viewing this banner lead to a purchase. If the total revenue from these purchases is $800, you could infer that the banner influenced $320 of that revenue. This gives you valuable insight into the effectiveness of the banner in the context of the entire user session.
However, one of the challenges with session-based tracking is the potential loss of granularity. Since it focuses on the session as a whole, it might not provide as detailed insights into specific user actions as event-based tracking does. Moreover, understanding the impact of individual elements on a website becomes more complex.
Session-based tracking offers a macro-level view of user behavior, allowing you to gauge the overall effectiveness of your website or app in engaging users. While it might not offer the event-level precision of event-based tracking, it provides valuable insights into user sessions and broader behavior patterns, which are crucial for strategic decision-making and optimizing the user experience.
Best Practices for Revenue Attribution
Implementing a unified tracking strategy that blends both event-based and session-based tracking methodologies is crucial for a comprehensive understanding of user behavior. This dual approach ensures no aspect of user interaction is overlooked, whether a fleeting event or an entire user session.
Consistency is key when it comes to tagging and naming events. It's essential to maintain uniformity across all channels and campaigns. This uniformity is not just a matter of neat organization; it's vital for accurate data aggregation and analysis. When everything is tagged consistently, you compare apples to apples, making your data analysis much more reliable and insightful.
If you are tracking some tool’s impact with its own data tracking capabilities, it is also a nice practice to look at the tool’s analytics dashboard. For example, you have created a story_group_click event and wanted to track the sessions linked to that interaction. A good practice is to also look at Storyly’s dashboard and validate the metrics across dashboards. It is also beneficial to analyze in-platform behaviors like average duration, button clicks, etc for further analysis.
Regular testing and validation of your attribution model cannot be overstated. It's like tuning a musical instrument; you must constantly adjust to ensure it plays the right notes. Experiment with different models to see which one resonates best with your data, providing the most accurate and insightful results. As I said, there is no correct answer here but a suitable one for your case at a given time.
Lastly, ensure that all stakeholders are on the same page regarding the attribution model and its implications. Clear and consistent communication is crucial. When everyone understands the model and its impact on decision-making, your team can make more informed, data-driven decisions.


